Cubes & coordinates
A cube is a multidimensional spreadsheet. Where Excel has one sheet with
arbitrary cells, a cube has structure: every cell sits at the intersection of
well-defined dimension items — for example Revenue × France × Jan 2026.
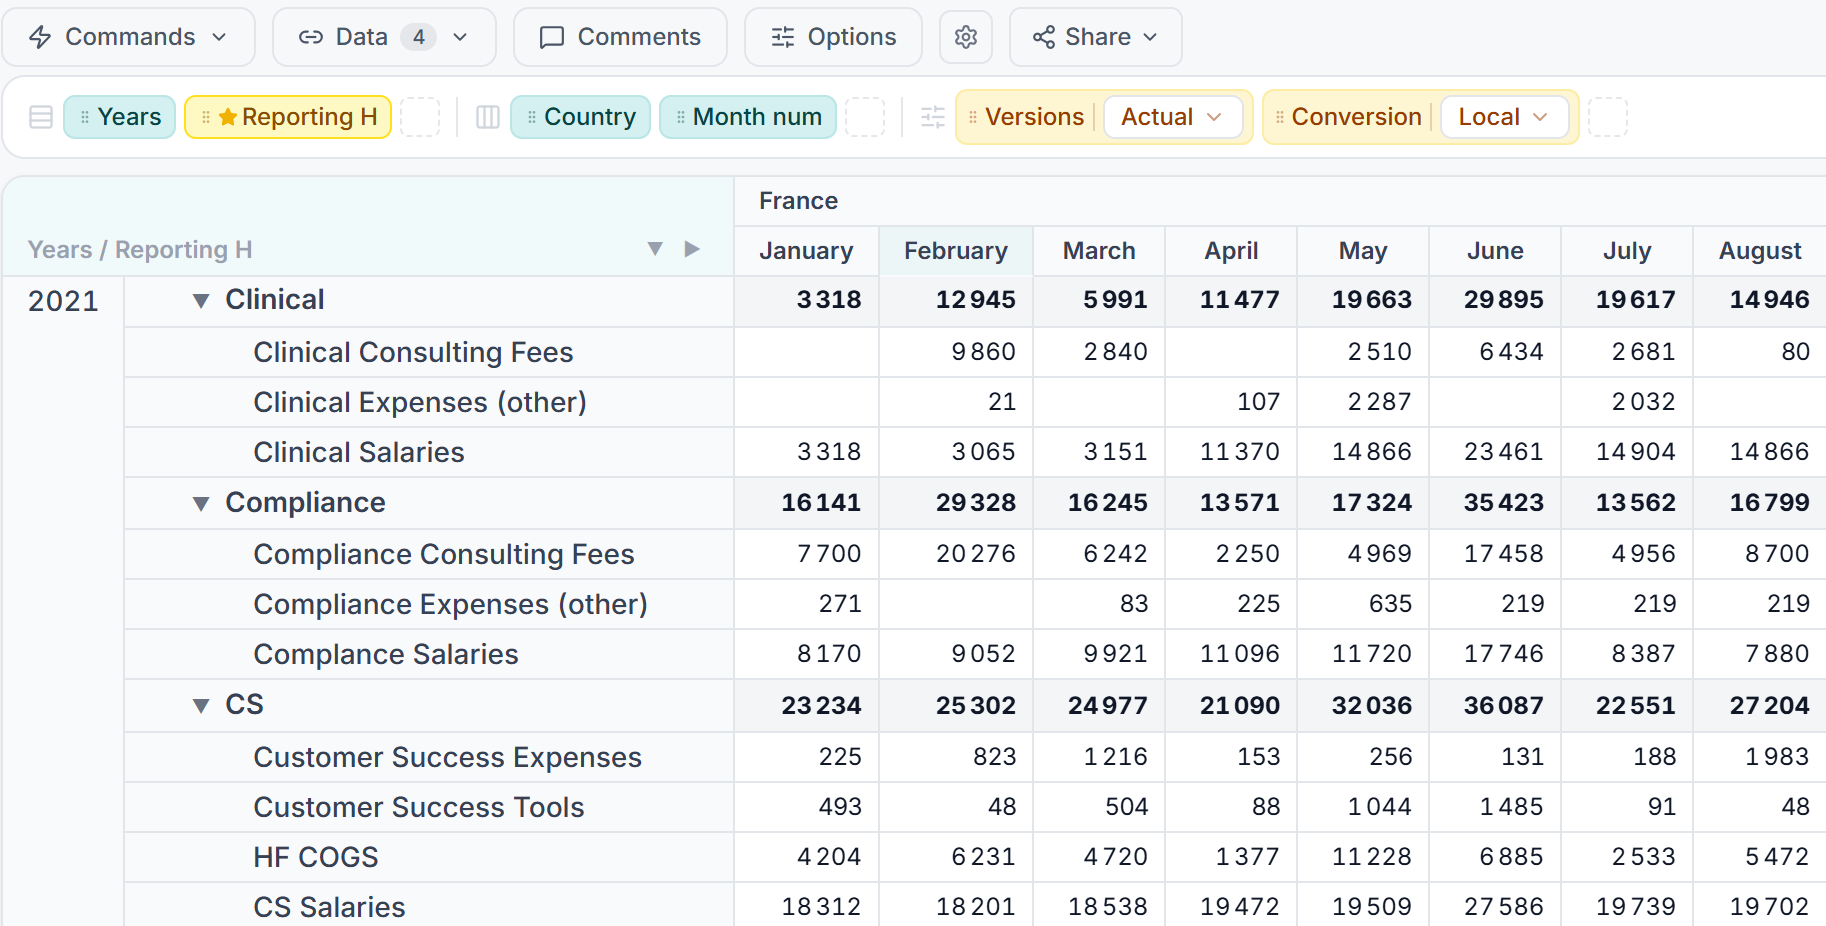
The cube grid: row and column dimension items form the axes; every cell value sits at a precise coordinate.
Coordinates
A cube is defined by the dimensions attached to it. To read or write a value you specify one item from each dimension — that tuple is the cell's coordinate. There are no free-floating cells: if a coordinate isn't a valid combination of items, it doesn't exist.
This is why a tool reading cube data must walk the dimension items rather than
guess codes. Use get_cube_structure to discover each dimension and its items,
then pass exact item codes to get_cube_data.
Commands — bulk edits without formulas
Beyond typing values and writing formulas, you can apply commands that transform cell values in place — no formula required. They cover the common bulk edits: clear, fill (a constant or random values), add / subtract / multiply / divide by a value, invert sign, absolute value, percent, spread a total across cells, and lock / unlock cells.
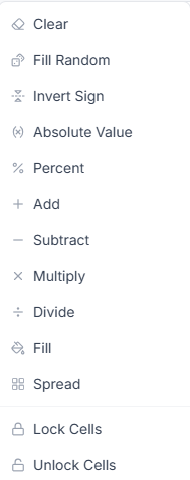
The commands menu: bulk operations applied directly to cell values, without a formula.
Each command runs over a scope you choose — the current section (the block you are in), the whole grid, or a custom selection of rows and columns you pick in the selection dialog. That makes one-off adjustments (e.g. "multiply this region by 1.05" or "clear last year's actuals") quick, without touching the model's formulas.
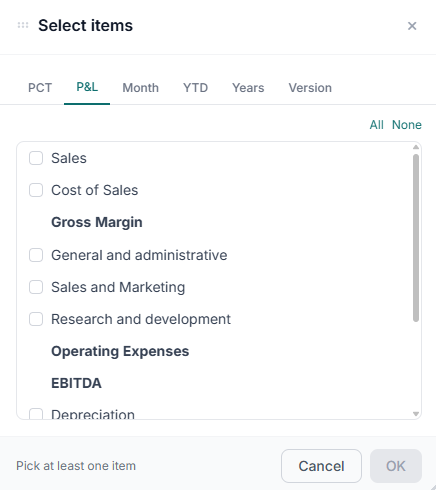
Defining a custom selection: switch between dimension tabs and tick the items to include — the command then runs over exactly that slice.
Navigator — where the data actually is
The grid always shows a two-dimensional projection of the cube: two axes nested into rows and columns, every remaining dimension pinned to a single item by a page slicer. That is what makes a cube readable — and it is also what makes the rest of the model invisible. Nothing on the grid tells you how much sits outside the current slice, or which slices hold anything at all.
The Navigator (toolbar button above the grid) answers that. It draws one strip per dimension, left to right in item order, shaded by how many cells hold values in each item's slice: pale runs are unpopulated regions, dark bands are where your data actually lives. The header states overall coverage and how much of it falls inside the slice you are currently looking at.
Entered and calculated cells are counted separately. Formula cells are computed eagerly, and a formula over empty inputs still evaluates — so on a model with subtotals, counting everything together would paint the subtotal rows as the densest part of a region nobody has touched. Counted apart, each strip says how much of a dimension somebody typed into and how much the model derives.
The shading leads with the calculated cells — on most models those are the lines you read, and the inputs are the many mundane ones feeding them. So calculated items carry the strong shade and entered data the lighter one, and a calculated item always reads stronger than an entered one however few cells it holds. A glance at a strip tells you the shape of the model: where the subtotals sit, and which stretches are raw input.
Selections on the Pages axis cross-filter the other strips, so each strip answers "given my other selections, what would I see if I moved this one". A dimension's own selection never filters its own strip — that is what lets you see where else there is data before you go there.
Every strip is clickable, and what a click does depends on the axis: on a Pages strip it moves the slicer straight to that item; on a Rows or Cols strip it scrolls the grid to that item and selects it. If the item has been filtered out of the current view, the navigator says so rather than scrolling somewhere arbitrary.
Why it matters
Because the structure is explicit, formulas can reference items by name, totals roll up automatically, and the same data can be sliced along different axes without copying it. See Dimensions and Formulas.