Data tables
A cube holds numbers at coordinates. A great deal of real data is the wrong shape for that: a journal line carries a description, a contract carries a counterparty and a renewal date, a task carries an owner and a status. Cube cells are numeric only, so there is nowhere for the text to live — and one row per event does not map onto fixed dimension items in the first place.
A data table is the other container. It is a row-and-column grid with typed columns, stored at the project level under Data, and it is the right home for anything transactional or textual: an elimination journal, a transaction log, a headcount or contract register, an assumption list, a task tracker. A table holds one or more sheets, each with its own columns and rows.
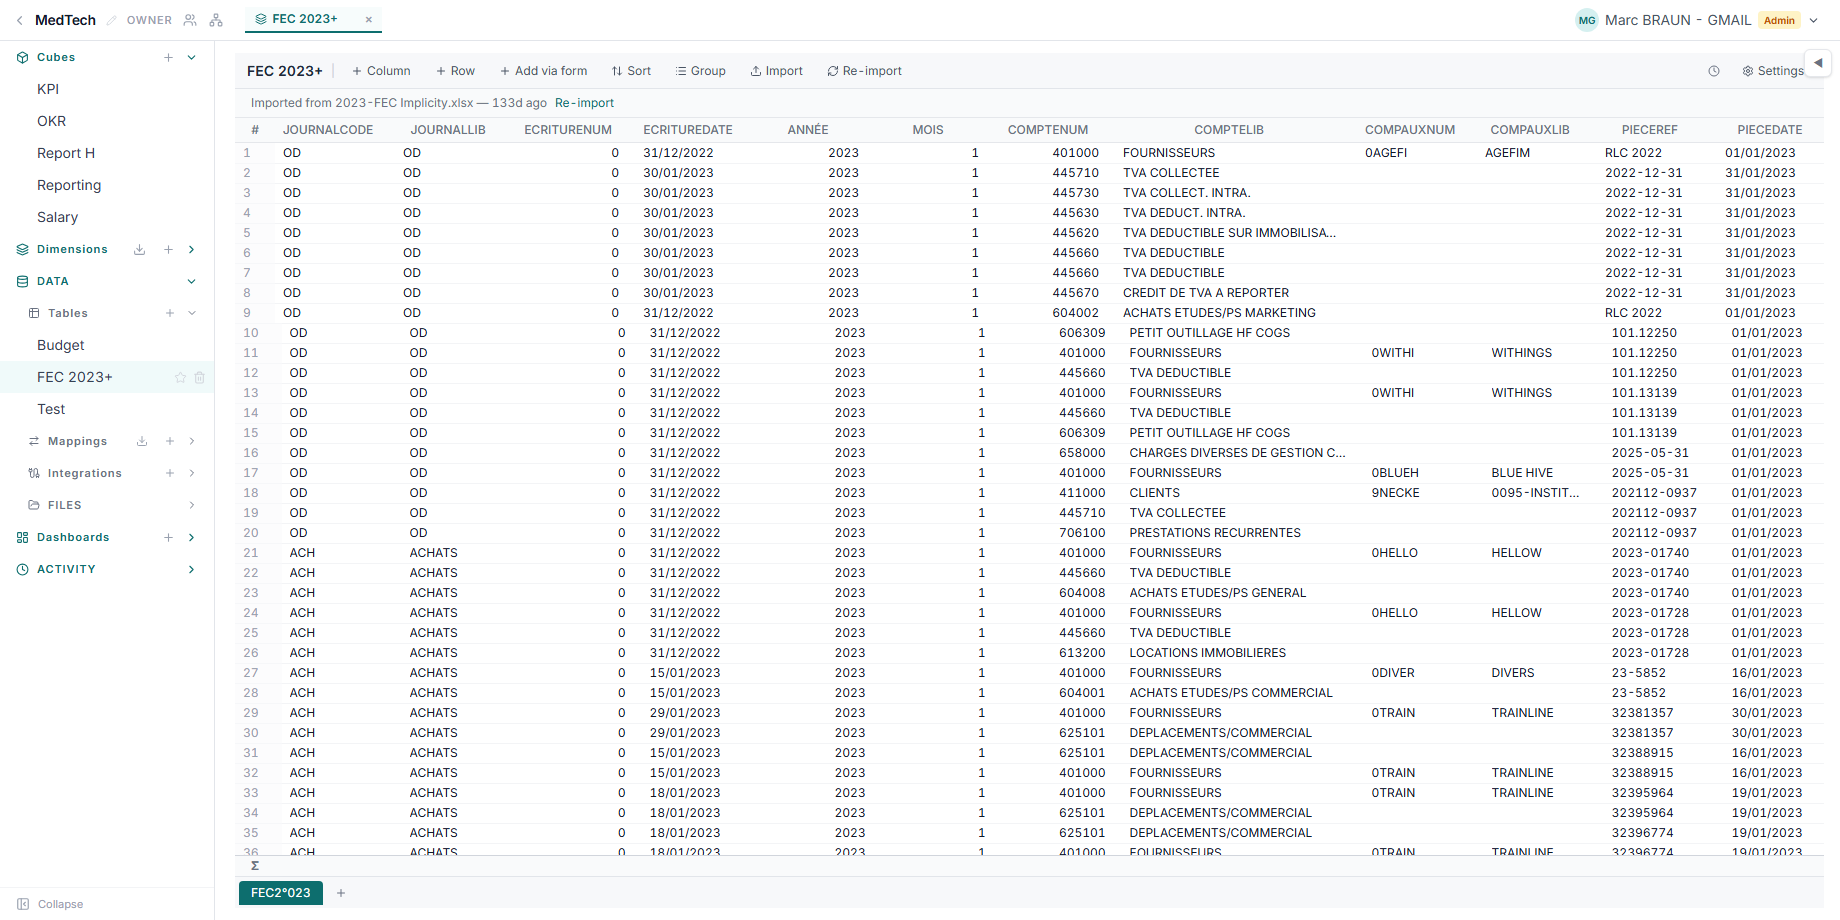
Typed columns
The column type is what the rest of the product reads, so it is worth setting deliberately:
| Type | Holds |
|---|---|
| Text | free text |
| Number | a numeric value, with a display format |
| Date | a date, with a display format |
| Boolean | a checkbox |
| List | one of a fixed set of choices, each optionally colored |
| Formula | a value computed from other columns, which it references in [Brackets] |
| Dimension | an item of a dimension, offered as a dropdown |
A dimension column is the join between the two worlds. Its values are real dimension items rather than typed strings, which is what lets a table address cube coordinates without anyone re-keying codes — and what makes a mistyped code impossible rather than silently skipped later.
Column roles — how a table addresses a cube
Beyond its type, a column can carry a role that declares its part in a transfer:
- A column with the dimension role names the cube dimension it addresses.
- Exactly one column per sheet may carry the value role: the number to move.
Set the roles and a Link from this table into a cube derives its entire mapping from them, with nothing further to configure. A table built this way — one dimension column per axis, one value column — is the most direct path from records to a cube.
Transforms — cleaning up without destroying
Each column header carries a ▾ menu, shown on hover, of the transforms scoped to that column — rename, hide, cast its type, format a date, filter rows out — and a ƒx button beside the header row derives a new column from an expression. They accumulate into an ordered list applied on the way out.
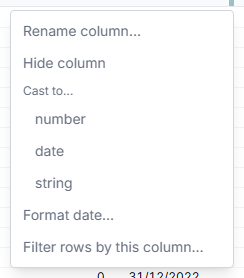
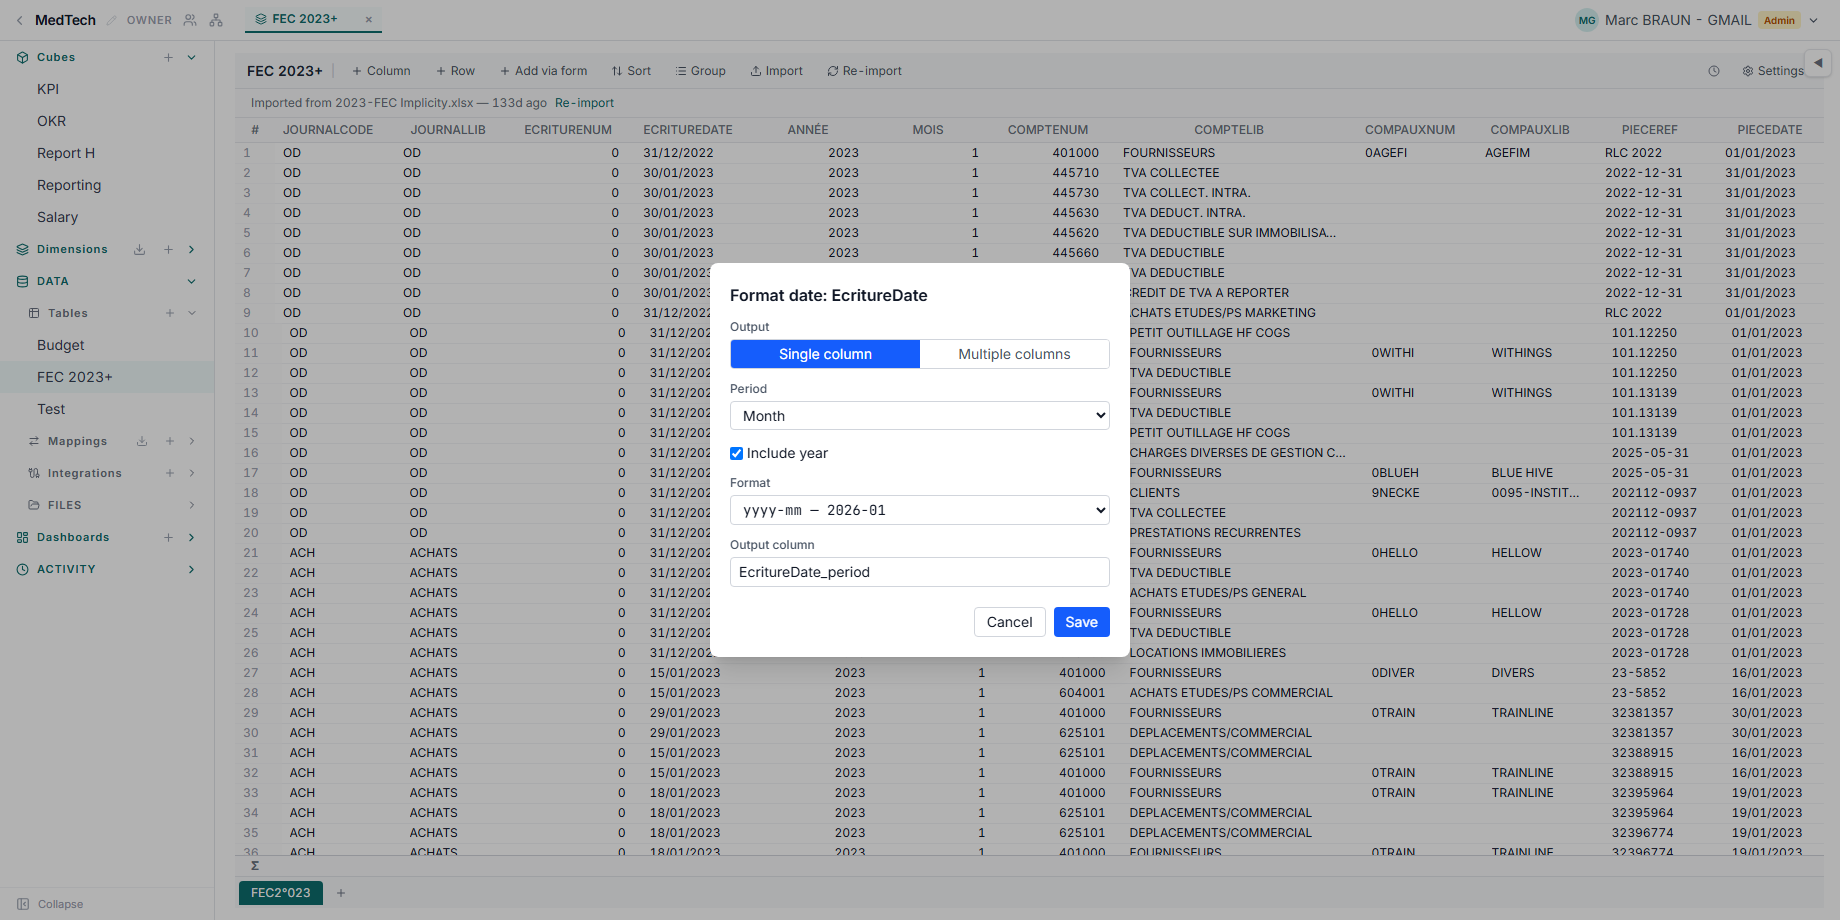
Format date is the one worth knowing about, because its dialog chooses the
output shape. Single column rewrites the date as a period code matching your
time dimension (2026-03, 2026-Q1), which is what makes a raw timestamp
linkable. Multiple columns emits one plain number column per component you
check — year, quarter, month, week.
Transforms never change the stored rows. They describe a view, so you can reorder or delete a step and the original data is still there — and a step that produces empty values or drops rows says so, with a count, rather than quietly shrinking the data. That is how a raw export becomes linkable without editing the export: an accounting extract whose date column is a timestamp and whose amount arrives as text ends up a sheet with a period code and a real number.
What reads a data table
- Links carry its values into a cube, on demand or on a schedule, translating codes through a mapping table where the two sides disagree.
- Dashboard widgets read it directly — a data-table grid, a cross-tab pivot of it, a Gantt, a board, or a ranking. See Dashboards.
- Mapping tables can take their source list from a table column instead of a dimension: pick the table, sheet and column, and the editor offers that column's distinct values, with row counts, as the things to map from — usually closer to the truth than the dimension you hope they match.
- Nothing at all: a register or assumption list is worth keeping in the project as the documented source of a number, even when no cube ever reads it.
Editing rows
Rows are edited in the table grid, one cell at a time or through a row form, and edits are undoable. Two things do not follow automatically:
- A row edit does not move into the cube. The Link that carried it has to run again. The same applies to deletions — though a Link in replace mode also clears the cells the deleted rows used to write, because it tracks the footprint of its last run.
- A board card dragged to another lane is the exception — that writes the new status straight back to the table, because the card is the row.
For getting values from a table into a cube, see Populating cubes — Links & integrations. For a spreadsheet you want in a cube directly, without a table in between, see Import a spreadsheet into a cube.